Did Marriage Outside the Family Shorten the Patriarchs’ Lives?
A fitted curve, a change before Nahor, and what they explain
Genesis 11 records a family whose lifespans generally diminish over successive generations. On the reading explored here, Noah’s family entered an already inhabited world and its descendants married into ordinary-lived populations. Could that help explain the recorded decline? A mathematical model gives this suggestion some substance.
Start with the earlier generations
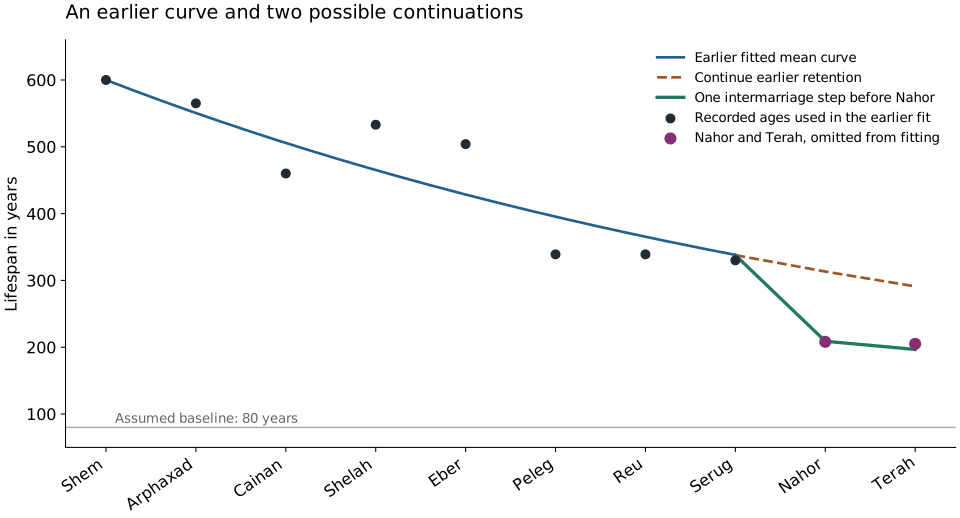
The study begins with Shem’s 600 years and fits the ages from Arphaxad through Serug. It represents extraordinary longevity as a collection of inherited contributions that can diminish over generations. Its average lifespan follows a declining curve, approaching an assumed ordinary baseline. Individual lives can fall above or below that average.
This is an exponential curve: the same proportion of the remaining excess is retained at each step, rather than the same number of years being subtracted. With a baseline of 80 years, the best-fitting version retains about 90% per generation before Nahor. This is a model parameter, not a measured marriage rate. Nahor and Terah are left out when those earlier parameters are fitted.1
Why introduce a change before Nahor?
Genesis 10:25 places the division of the earth in Peleg’s days. The scenario examined in this study places Babel near the end of Peleg’s life. On the chronology used here, Nahor is the first named member of the later line born after that point. Dispersal could bring a previously close family into more extensive marriage with surrounding peoples.
This supplies an interpretation to test within the model: before Nahor, substitute a major intermarriage step for the earlier gradual retention. Genesis does not name Nahor’s mother or expressly describe this marriage. The proposed connection between dispersal and marriage is the additional assumption being explored.
What the comparison finds
The study compares continuing the earlier pattern with halving the inherited excess once, before Nahor, then resuming the earlier retention pattern. At an 80-year baseline, the latter gives Nahor’s recorded age about 5.4 times the predictive density of continuation. For Nahor and Terah together, the ratio is about 9.9.
In plain language, the intermarriage version places more of its expected outcomes near the recorded ages. Across baselines of 40, 60, 80 and 100 years, it is favoured by about 4.5–5.6 for Nahor and 6.8–10.7 for the pair. Using 460 rather than the tentative 533 for Shelah preserves the direction of the result.1
That is a useful finding within the reading: the proposed step accounts for these ages better than uninterrupted gradual decline in this model. These ratios are not odds that Babel occurred, that Nahor’s mother came from another population, or that the two-worlds reading is true.
Where 205 and 208 come in
A simpler calculation shows why the size of the change is interesting. Serug lives 330 years. If an ordinary-lived parent contributes none of the model’s extraordinary longevity, and the child receives half of Serug’s excess above an 80-year baseline:
80 + ½ × (330 − 80) = 205 years.
Nahor’s recorded lifespan is 208. An exact match would use a baseline of 86. This close agreement explains the intuition behind the intermarriage step. It is a separate arithmetic check, not a replacement for the fitted-curve study, and 80 is an assumed lifespan baseline, not a measured ancient average or life expectancy at birth.
Why not halve at every generation?
Terah lives 205 years, almost as long as Nahor. Repeated full halving would predict a further substantial decline. The tested single-step model accommodates this better: later marriage need not always be with someone carrying none of the inherited contribution. Real inheritance could also produce differences among children. The model simplifies these processes; it does not reconstruct the mothers’ genomes.
What about fatherhood at 130?
Arphaxad through Serug father the named sons at 130–135 years: seven successive men in a remarkably tight band, despite considerable differences in their lifespans. Nahor then fathers Terah at 79, and Terah fathers the next named son at 130. The clustering calls for an explanation.
If these men became fertile around twenty, married reasonably early and had children with ordinary frequency, their first sons consistently arriving around 130 would be very surprising. Delayed reproductive development offers a natural explanation within this reading. Delaying marriage until that age is another possible explanation, but it too needs a reason for the consistent timing.
The strength of this inference depends on whether the named sons are first sons or later sons selected for the genealogy. If they are first sons, the case for unusual reproductive timing is considerably stronger. If they are later sons, early fertility is easier to accommodate, although selection alone does not explain the tight cluster. The figures therefore provide a positive reason to investigate delayed reproductive capacity; they do not locate puberty precisely.
The study explores a recessive inheritance mechanism for Nahor’s earlier fatherhood and Terah’s return to the earlier pattern. That is a conditional model of reproductive development, not a demonstrated count of reproductive genes. Numerical odds for the clustering would require justified assumptions about first sons, marriage, childbearing and how the recorded men were selected. No such odds are claimed here.
The first decline needs another part of the explanation
Noah lives 950 years and Shem 600. Shem was born before the crossing to parents from the ancient world. Marriage with our world’s inhabitants cannot account for that difference. On the natural reading, Arphaxad’s parents also both came through the ark.
The wider two-worlds proposal includes changed living conditions as well as marriage. Differences in environment, development or their interaction with inheritance could belong to that account. Shem’s decline challenges intermarriage alone; it does not by itself contradict the wider reading. What remains undeveloped is a biological model of those environmental effects and of the exceptional lifespans themselves.
How this fits modern biology
Modern research supports contributions from both inheritance and environment to lifespan. Estimates of their relative importance depend on the populations and causes of death studied. A 2026 twin study estimated that inherited differences account for about half the variation in its model of intrinsic lifespan, after adjusting for external causes of death. Earlier large family studies gave much lower estimates for lifespan under different assumptions.2
This makes an inheritance-and-environment account worth developing. It does not establish that extra years are inherited additively or that a modern human mechanism can sustain several centuries of life. “Half the variation” in a population is also a different concept from receiving half a parent’s modelled longevity contribution.
What we can reasonably conclude
The study gives the intermarriage proposal quantitative explanatory promise: a change of the proposed size improves the account of the later ages across the tested baseline choices. The combined environmental and inheritance account is more coherent than attributing every change to marriage alone. A full physiological explanation remains open.
Research notes: methods, earlier studies and corrections.